Confidence Interval

Confidence Interval

A confidence interval is the interval in which a population statistic is contained when estimated by a sample statistic.

Let μ be some population mean of same value and let X― be the mean of a sample of the population. Given an Level of significance of α (s.t. the interval is accurate in (1−α)% of cases), then a Confidence Interval for the population mean is:

μ∈[X―−z1−α2σn;X―+z1−α2σn]

where z1−α2 is the value of z (where z follows a Standard Normal Distribution) such that the area under the curve is equal to 1−α2.

Let's suppose z is the value we are looking for (for example, the exact value of μ). Let Z be any possible value of the Standard Normal Distribution. We can evaluate the probability:

P(Z≤z)

as the area in the interval (−∞,z). If for example we want that our estimate is accurate with a Degree of confidence of 95%, all we need to do is make sure we select a range wide enough such that, the range in question as an area of at least 0.95. That means, the area in the interval (−∞,z) has to be 0.052. (notice how the curve is symmetric and we want 95% to be the area in the middle). So, if we can find the value of z such that the area under the curve is 0.025, we will have a range of values that ensures us that the estimate is accurate at 95%.

In order to find this value it's important to use statistic tables. For the Standard Normal Distribution you can read more about them in Standard Normal Distribution#Statistical tables.
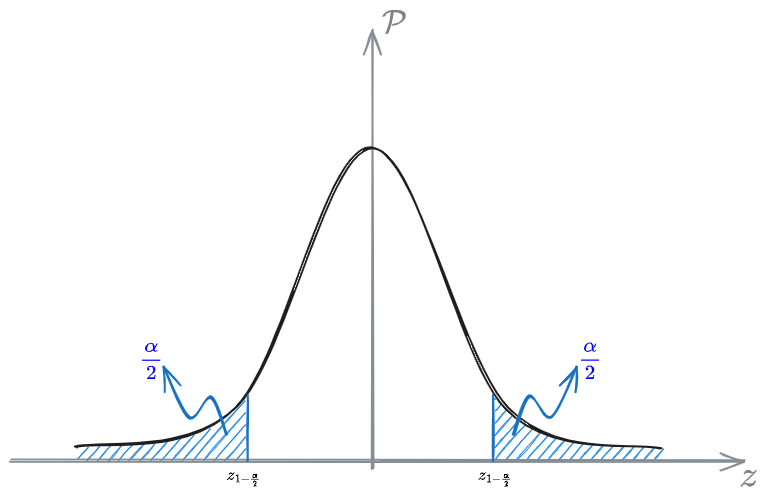
Confidence Interval 2025-03-16 19.27.14.excalidraw.png

We use the Standard normal distribution since is well known. Then, we scale it according to a factor dependent on the variance of the variable we are interested in: σn.

One particular variable of a population has a mean of μ (unknown). We have a sample of the population with a mean for the same variable equal to X―. Let's suppose we know the population variance, σ2. The sample is composed of n elements.

We want an estimate for the population mean with 95% confidence. This mean we want an α=0.05.

We are basically looking for the value:
z1−α2=z1−0.052=z1−0.025=z0.975
that is the value such that the area under the density distribution is equal to 0.975.

From the probability table we can find out that such value is:
z=1.960
given a large number of observations.

We are assuming to know the variance of the population. This is clearly impossible. Actually, also the variance, as the mean, follows a random probability distribution (that can be proven to be a ???). For the porpuses we are usually interested in, we can simply use the sample variance (s2) in place of the population variance.