03 - Trip generation modeling - TDBM
03 - Trip generation modeling - TDBM
https://www.youtube.com/watch?v=7BenAd8-5_c&nohtml5=False
The first step in Trip Generation modeling is gathering a zoning system: that is a group of TAZ that cover all the area of interest.
Trip generation is the first step in the modeling stage of the classic 4 stage framework.
In terms of an O/D matrix like the following, in this step we try to model the marginal totals: all
where:
number of trips from TAZ to TAZ tot number of trips generated by TAZ - It's the sum of the colums
tot number of trips attracted by TAZ - It's the sum of the rows
tot number of TAZs
Growth factor
One of the main objective in travel demand modeling is being able to predict future scenarios starting from a current one. In this section, we assume trip generation/attraction per zone is known for the present, and we want to obtain a prediction of it in the future given a change in some variables (population, income, motorization...)
Growth factor - Fratar
One #Growth factor was defined by Fratar in 1954 as:
where:
is the index that identifies the TAZ is the growth factor : population income Motorization state wether the parameter is referred to the Current or Future scenario respectively
Once the growth factor is obtained, the future trips,
Growth factor - Cobb-Douglas
A generalization of the #Growth factor from Fratar is given by Cobb-Douglas production functions. This formula has the same form of the previous one, but can take any parameters the researcher wants to use and also adds an extra parameter,
Category analysis
In category analysis we don't use the TAZs to describe trip generation. We only use factors that describe the population.
For example, we know how many trips are generated by a household of a certain size with a certain number of workers:

For example, the table above shows that a household with 3 people (2 of which are workers) generate 2.661 trips from Home to Work.
- It only uses categorical exploratory variables
- It is not related to Transport Analysis Zones (at a first stage)
Once the current situation is known, then we will have to apply it to forecast future trip generation (therefore, we will need to refer each generation to a zone).
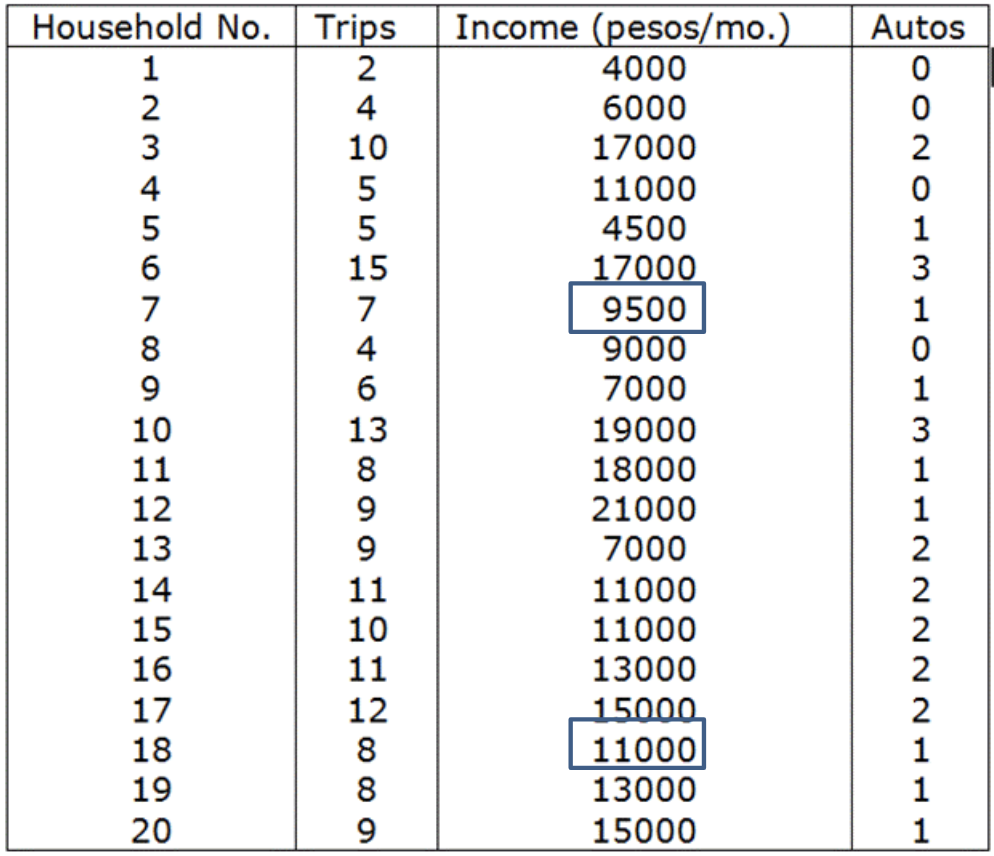
Here we show an example of category analysis taking into consideration HH income and autos owned.

20 HH where interviewed and each stated the number of trips produced.
Given the distribution observed, we create 2 factors: one for number of cars, one for income:
- Number if cars:
- 0
- 1
- 2 or more
- Income:
For each combination, we list all the household numbers that fall in that combination:

For example, we can see that for a HH with income between 9 and 12 thousand pesos and 1 car, we have an HH 7 and HH 18 that combined produce 15 trips (read from first table: 7 produces 7 trips and 18 produces 8 trips).
We then calculate the average number of trips produced in each category. For example, for income between 9 and 12 thousands and 1 car, we have

Linear Regression Analysis
❗❗❗❗❗❗❗❗❗❗❗❗
❗❗❗ COMPLETARE ❗❗❗
❗❗❗❗❗❗❗❗❗❗❗❗
SEE SLIDES