02 - Data and Space - TDBM
02 - Data and Space - TDBM
When trying to model transportation patterns, one of the biggest challenges is the data collection. There are several ways of collecting data:
-
Traffic detection stations: inductive loop detectors, radars, magnetometers...
-
Antennas to capture Bluetooth or Wi-Fi equipped devices
-
CCTV image processing (License plate recognition, emulation of Traffic Detection Stations)
-
Capture of digital footprints (ex: TAGs)
-
GPS tracking of fleets
-
Telephone [[#Surveys]]
-
[?] What is the difference between "inductive loops" and "magnetometers"?
Surveys
Surveys are an active data collection process. Data is collected based on pre-defined questions. When carrying out surveys, only a portion of the population of interest is interviewed. This portion is referred to as the sample.
They can be carried out in several ways:
- Calling on the phone
- By mail
- In person
A survey is different from a census because, in a census, the whole population is interviewed. In a survey, the information gathered from the #Sample is then expanded and associated to the rest of the population. There are several ways of selecting a sample. More information can be obtained in [[#Sample Theory]].
It is highly recommended the use of questionnaire, allowing for standardized, pre-defined questions that should be asked to everyone in the same way.
Some surveys focus on opinions and attitudes, such as election polls. Others are concerned with factual characteristics or behaviour, such as transportation habits, housing or consumer spending.
Questions can be asked in an open or closed format. Closed questions are much easier to interpret than open ended questions. Preferably, for ease of analysis, all questions should have a binary response.
Usually, surveys combine questions of different types.
There are many stages in a survey process:
- Goal setting
- Survey design
- Sampling
- Data collection
- Capture
- Cleaning
- Analysis
- Reporting results
- Decision-making based on the results
Survey types in transportation systems
- [[#Household travel/activity surveys]]
- These are used to collect data about households or individuals.
- Nowadays, they are not used anymore to generate Origin/Destination matrixes since they are expensive and we have cheaper alternatives available
- They only interview a subset of all residents (a sample)
- Vehicle intercept and external station surveys
- [[#Transit on-board surveys]]
- [[#Transit operator - satisfaction surveys]]
- [[#Commercial vehicle surveys]]
- Workplace and establishment surveys
- [[#New sources of mobility data]] (phone data)
- [[#Special generator, visitor surveys]]
- [[#Parking surveys]]
- [[#Revealed versus stated preference]]
EMEF surveys are done every year in Barcelona. About 10'000 people are interviewed by phone. The survey is about the last working day trip the responder took (it's about the whole day trip)
Household travel/activity surveys
In the 1950/60s, surveys were conducted on a large sample, about 3 to 5% of all households. The goal was to estimate O/D matrixes for region. At the time, TAZs were much larger because computer capacity was limited.
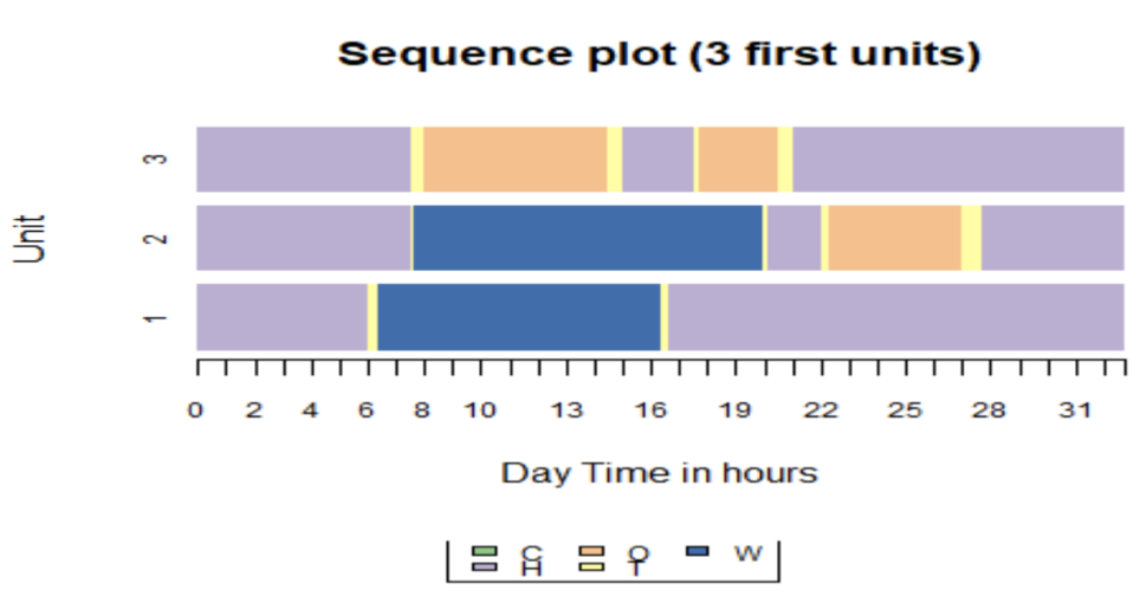
Today, we only interview 2000 to 15000 households (corresponding to about 0.3%). The goal is no longer to obtain O/D matrixes, but to to get daily activity pattern sequences
Transit on-board surveys
These are surveys usually conducted by transport agencies. Some data may already be known beforehand, like count of boarding, but lack information about customer characteristics, like frequency of transit trip-making, car availability, origin-destination...
Transit operator - satisfaction surveys
These are to quantify the importance of items related to day to day conditions of transit network. For each item, the responders selects a score (from 1 to 10, or on the [[Likert Scale]]).
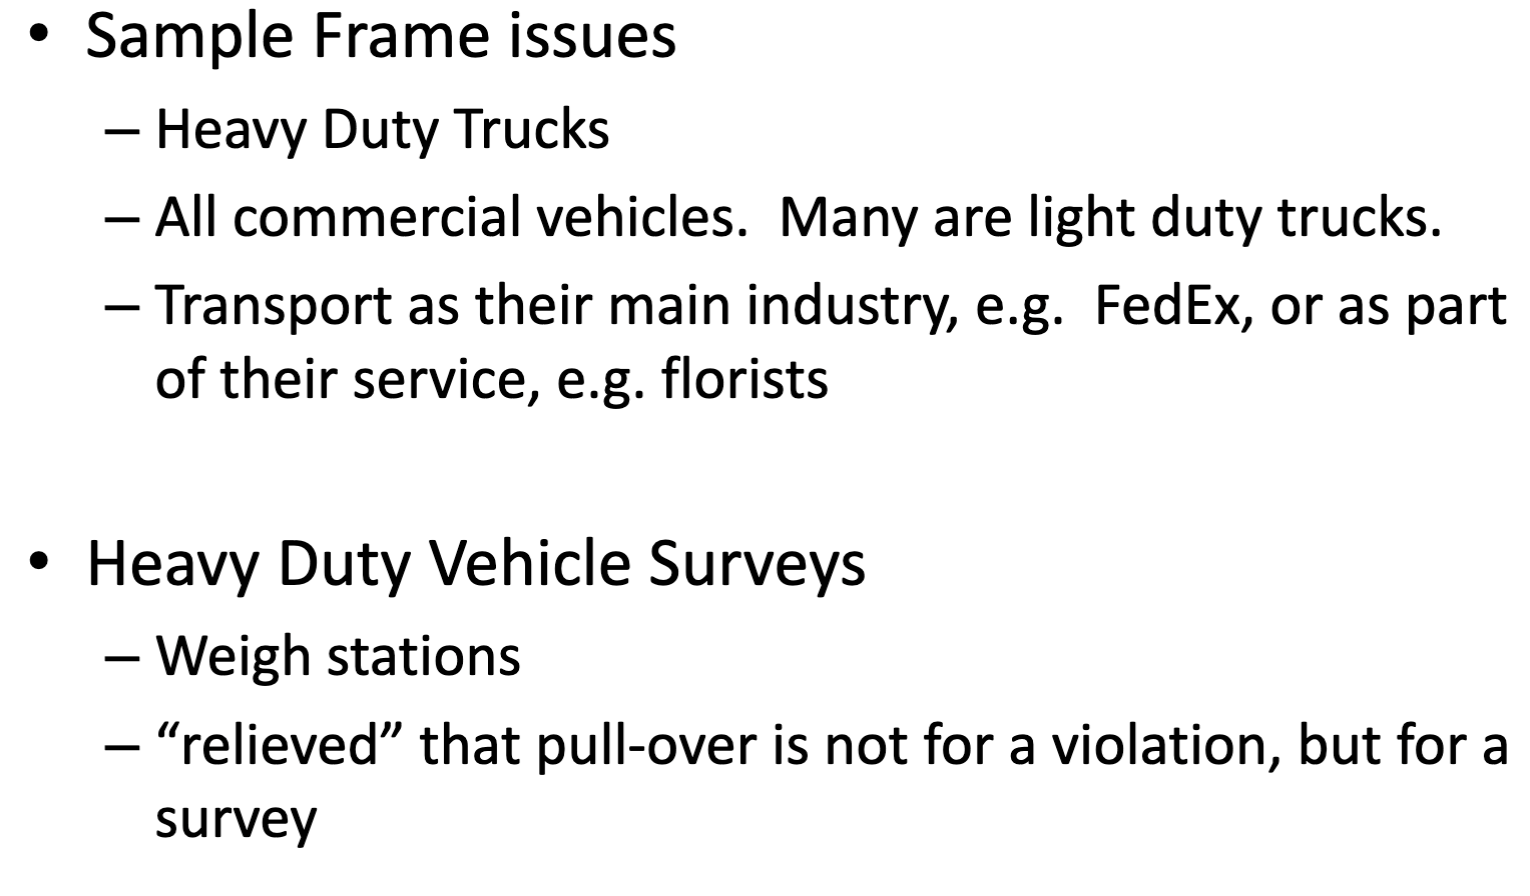
Commercial vehicle surveys

New sources of mobility data
New sources of data collection include:
- Data from social networks
- Data from call detail records (CDR): mobile phone data
This sources are now used to extract OD matrices but do not provide modal data for urban trips, since they are too short.
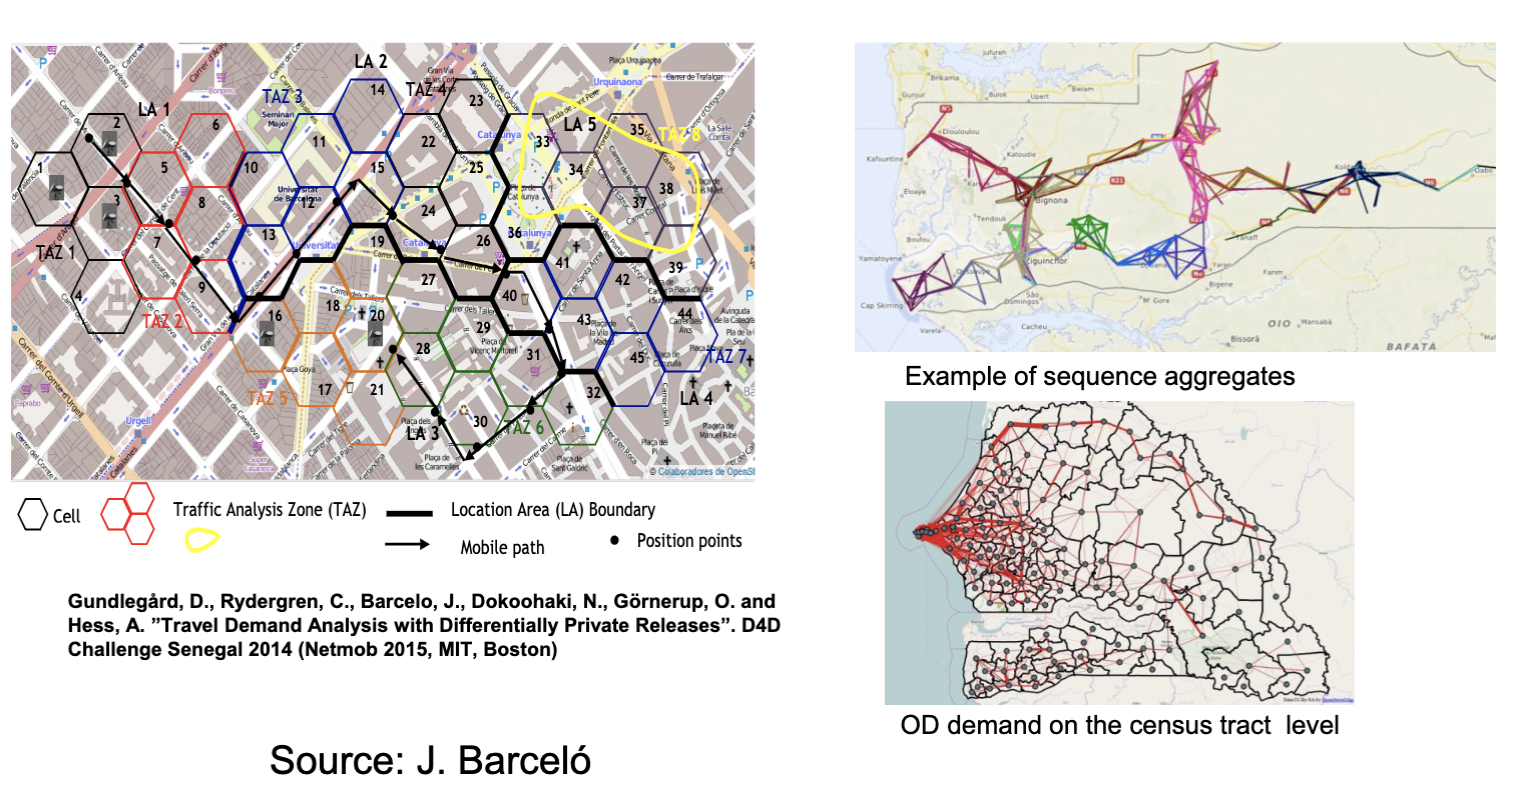
Nommon is an IT company in Barcelona that produces mobility data from Call Detail Records (CDR) and network probe of the Orange telephone operator to generate OD matrices.
It does not include modal split. It does provide trip length estimation and precise timestamps.
Special generator, visitor surveys
Special generator, visitor surveys are intended for specific demand attraction points like tourists hotspots, big shopping malls, airports.
Parking surveys
Parking surveys ask about distance to final destination, duration of stay, posted prices vs cost for the individual...
Revealed versus stated preference
Sometimes we are interested in knowing the factual state of the art. In other occasions, we want to investigate what people think of a new scenario that does not exist yet.
Revealed preference
A revealed preference is the actual behaviour of the individuals.
When we collect data from surveys on actual travel, then we are collecting infromation on revealed preference.
Stated preference
A stated preference is obtained by asking the responders about scenarios that do not yet exist.
Responders are asked about hypothetical fictitious conditions, with typical variables strategically defined by means of experiment design and measurign the selected choice by the individuals in different conditions.
Conditions for valid results are:
- Design should be undertaken by expert personnel
- Alternatives should be described realistically and accurately
- The presentation of hypothetical alternatives must be intelligible and concise
- The responses may be choosing an alternative, or establishing a ranking or preference among alternatives
- The order, presentation and number of alternatives/factors is important
- A pilot test is necessary to detect problems in the design
Louviere, J.J., Hensher D.A. and Swait J (2000) [[Stated Choice Methods: Analysis and Application]]. Cambridge Univ. Press, Cambridge
Errors in stated preference data
Bias statement
The respondent answers, onsciously or unconsciously, what they think the interviewer wants
Rationalisation Bias
The respondent tries to be rational in their responses in order to justify their behavior at the time of the interview.
Political Bias
The respondent answers in order to influence policy decisions based on their beliefs about how they can affect the results of the survey.
No restriction Bias
When responding does not take into account any restrictions on their behaviour, so that the answers are not real.
Questionnaire design
Questionnaire design is the process of writing the questions and possible answers.
Questionnaire usually contain:
- Socioeconomic descriptors of individuals (gender, age, education, social status, employment status, occupation, residence, family structure, income, wealth, etc.)
- Contextual descriptors: highly dependent on the object of study (contextual knowledge, behaviors, etc.)
- Practices descriptors and opinions: attitudes, habits, collective membership, etc.
The general organization, especially the order of questions, is important.
- go from general to particular
- go from less committed to most committed
- delicate questions must never go at the beginning or at the end
- socio-economic questions go to the end
- use transitional phrases to break the monotony and thematic changes
- first questions are usually strategic and set the tone and predispose the respondent: they must be neutral, pleasant and easy
- Avoid questions conditioning the response to the following questions
- When designing filter questions, try not to frustrate people that do not meet certain requirements
The order of the questions can influence non-responses.
- Employ a simple and suited vocabulary to the type of population studied. Pay attention to the opening words of issues and questions.
- Avoid asking a question so that response involves meeting certain requirements.
- Check the logical structure of the questions: interrogative sentences with negations, double negatives that can lead to ambiguity, misunderstanding and finally observation errors.
- Avoid introduction of two concepts in the same question and double question.
- Avoid loaded terms of affection, value judgments or sentences of different connotations depending on the context because the meaning of the question depending on the context of the individual changes.
- Avoid situations where ambiguities and to the same question can give you the same answer, but for different reasons.
- Authorize double responses in closed questions, but at least minimize them since the subsequent statistical analysis is greatly complicated.
- Closed questions (where individuals choose the answer from a list of possibilities) must cover all possible situations. Establish, where appropriate, a balance between positive and negative forms, checking the list of good possibilities offered.
Survey design
Survey design involves:
- Choice of data collection methodology (face-to-face in home or central location, telephone, e-mail)
- [[#Questionnaire design]]
- [[#Sample design]] and analysis planning
- Estimating survey costs
Statistical issues
There are some possible errors that may occur when analyzing data.
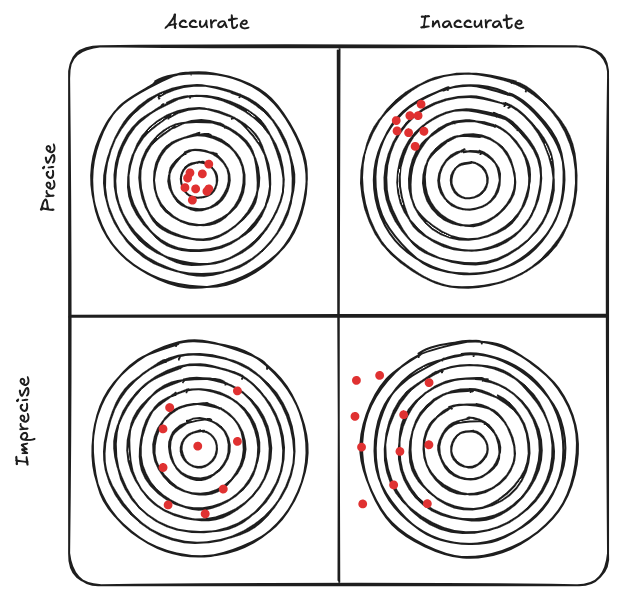
First, let's focus on the difference between [[Accuracy]] and [[Precision]]:
Lack of [[Accuracy]] corresponds to a [[#Systematic error]] (or bias) in sampling
Lack of [[Precision]] corresponds to a [[#Sampling error]].
Sampling errors
There are 2 types of sampling errors that may occur, summarized in the table below:
| Decision\Truth | ||
|---|---|---|
| Accept |
✅ | [[#Type II error]] |
| Reject |
[[#Type I error]] | ✅ |
These errors occur when we test an hypothesis and, the decision we take based on the p-value ends up being incorrect.
Type I error
Type I error occurs when the null hypothesis is true, but the sample leads us to reject it.
Type II error
Type II error occurs when the null hypothesis is false, but the sample leads us to accept it.
Sample theory
Sample size
It's important before any investigation to determine the sample size in respect to the population. Keep in mind that there is always a trade-off between the sample size and the resources available.
Sample size depends on various factors:
- Significance level [[#Confidence Interval]]
- Power
- Expected prevalence of factor of interest
Steps in determining the sample size
- Identify major target study variable
- Determine type of estimate (%, mean, ratio)
- Indicate expected frequency of the target variable
- Decide on desired precision of the estimate (absolute or relative error)
- Decide on acceptable risk that estimate will fall outside its real population value
- Adjust for expected response rate
- Adjust for estimated design effect
Statistical terminology
Unit
A unit is a single person, household, business that is intended to answer the survey.
Population
The population is the collection of units that the survey result should describe or explain. It's the set that includes all measurements of interest to the researcher.
A population is usually associated with a probability distribution. Therefore, we have a [[#Population distribution]].
Target population
Target population is the #Population we are interested in studying.
Population distribution
The population distribution is the probability distribution derived from the information on all elements of a population.
Sample
A sample is a subset of the population for which the survey data is collected
Sample distribution
The sample distribution is the probability distribution of a #Sample statistic (
Sampling frame
Sampling frame is the list of all sampling units from which the sample is drawn.
Sampling scheme
The sampling scheme is the method of selecting sample units from the #Sampling frame.
Why sampling
Sampling is necessary to get information about large popoulations.
- Less costs
- Less field time
- More accuracy - we can do a better job in the data collection
- When it's impossibile to study the whole population
Sampling schemes
- [[#Probability sampling]]
- [[#Judgment sampling]]
- [[#Quota sampling]]
- [[#Convenience samples]]
Probability sampling
Probability (or random) sampling is where each object has a known, non-zero probability of being selected.
It can produce unbiased results (if no non-response) and it allows for calculation of sampling error (if pairwise selection probabilities known). Most widely accepted sampling method.
It allows application of statistical sampling theory in order to:
- Generalise
- Test hypothesis
And it ensures:
- Representativeness
- Precision
There are several methods in probability sampling:
Simple random sampling
In simple random sampling we simply select responders at random from a given list.
Systematic sampling
In systematic sampling, we select at random one responder from a given list, then, based on how many responses we need, we select every n-th possibility from the list.
Stratified sampling
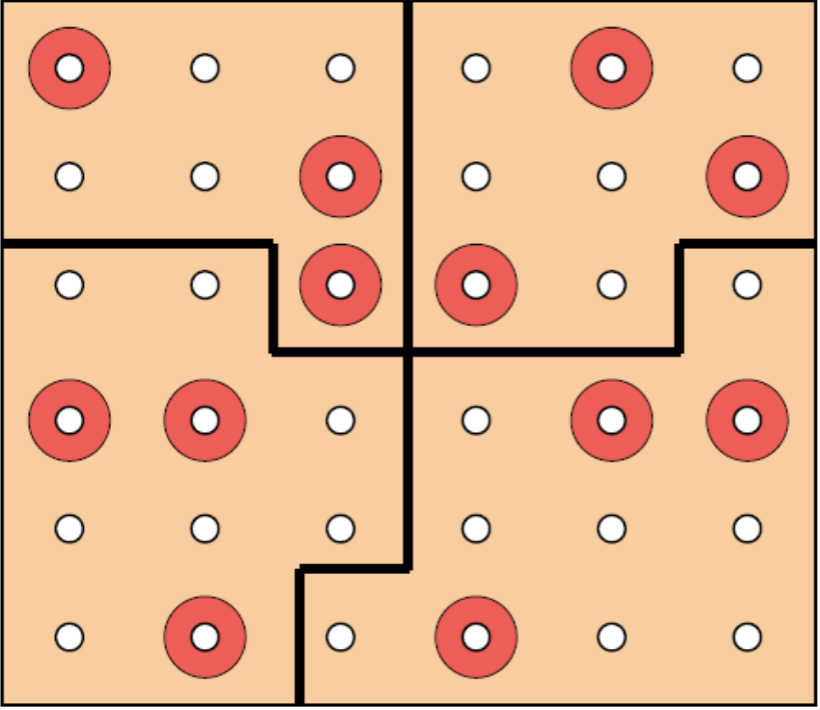
In stratified sampling we divide the population in strata (same age-group, same occupation...), then we draw a random sample from every stratus.
- [p] Can acquire information about the whole population and of the individual strata
- [p] Precision is increased if variability within strata is less than across strata
- [c] It can be difficult to identify strata
- [c] Loss of [[Precision]] if there is only a small numbers of individual in a specific stratus
Cluster sampling
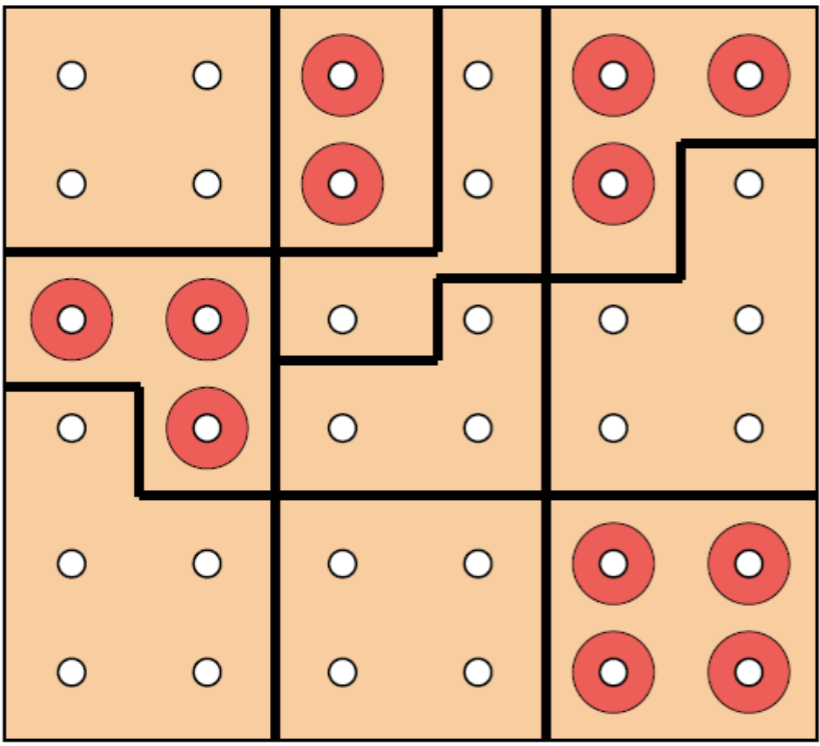
In cluster sampling, we dived the population in clusters, select some clusters at random, then survey every unit in each cluster.
Multi-stage sampling
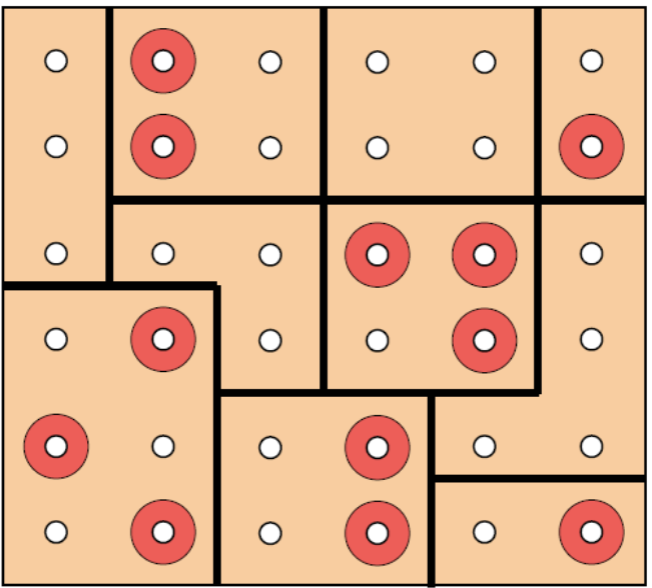
In multi-stage sampling we apply a combination of [[#Stratified sampling]] and [[#Cluster sampling]].
First, we select some strata at random, then, from the selected strata, we select units at random.
Judgment sampling
Judgment sampling involves choosing objects that it is believed will give accurate results.
Quota sampling
Quota samples are based on selecting objects until you have a certain number (the quota) of each type – Appeals to idea of a “representative” sample, but usually biased – Still widely used (especially for telephone surveys with high non- response levels)
- [?] Can you apply quota sampling a posteriori? For example, I end up with 60% of female responders so I exclude, at random, some female responders in order to have balance?
Convenience samples
Convenience samples are obtained by choosing the easiest objects available
Sampling from a finite population
A simple random sample from a finite population of size
Point estimation
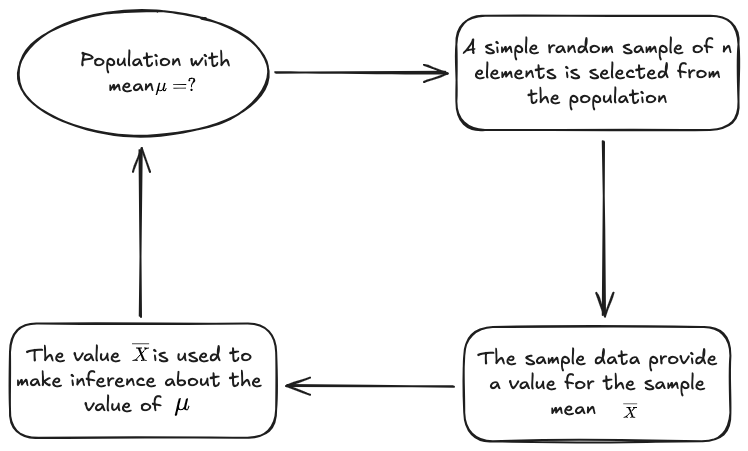
In point estimation we use data from a [[#Sample]] to compute a value of a sample statistic that we then use as an estimate of the population statistic.
A point estimate is as statistic computed from a sample that gives a single value for the population parameter.
We have a population of size
Let
Let the sample be the set of observations:
Then, the sample mean is:
I want, starting from
Statistics can prove that the [[Estimator]] (
This is not true for every statistic. If for example I defined a statistic like:
Then I don't know what its estimator is:
Inference
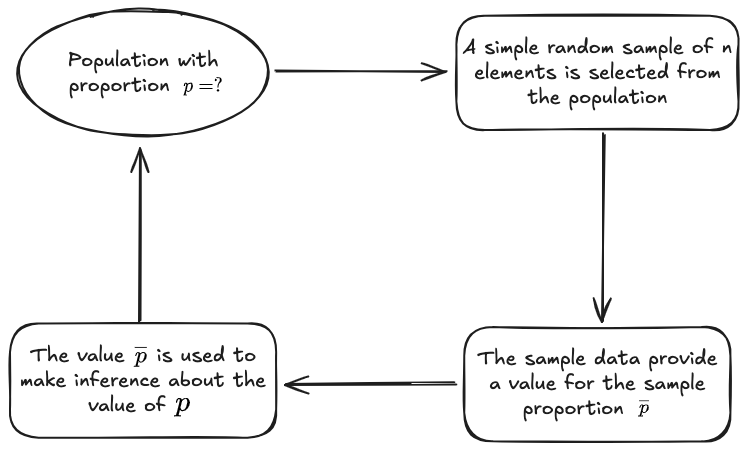
As explained in [[#Point estimation]], we have a sample of a larger population. We can calculate some statistic of the sample. Then, we can use it to infer the corresponding statistic of the whole population.
Let's imagine we have several samples:
- From sample 1, we get the sample mean
- From sample 2, we get the sample mean
- ...
- From sample n, we get the sample mean
We can now have many observations of a sample mean. This statistic is itself a random variable.
We can prove that:
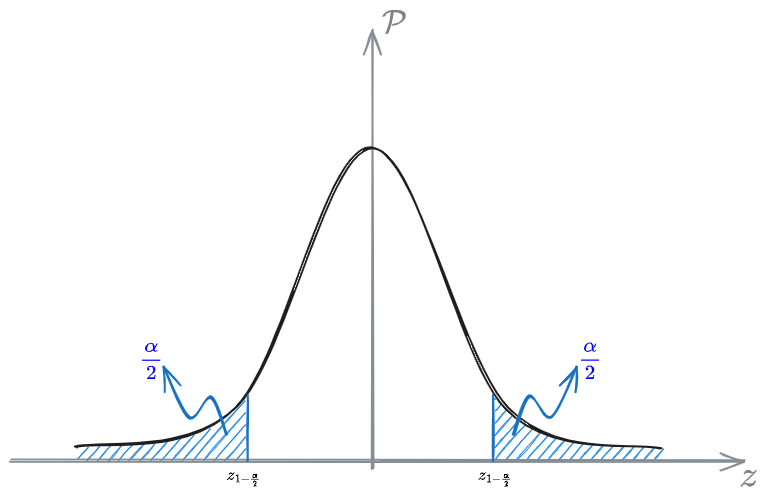
Then, we want an interval in which the population mean falls when estimating it from the sample mean. We want a [[#Confidence Interval]], according to some
Confidence Interval
Common estimator
Point estimator of population mean
The point estimator for the population Mean
Where
Point estimator of population variance
The point estimator for the population Standard Deviation
Point estimator of population proportion
The point estimator for the population Proportion
where
Inference of population mean
Sample distribution of sample mean
The #Sample distribution of the sample mean
In order to define it, we need to know:
- Expected value of
- Standard Deviation of
- The form of the sampling distribution of
Expected value of sample mean
The expected value of the sampling distribution of
- [?] What is
?
Standard deviation of sample mean
The [[Standard Deviation]] of the [[#Sample]] mean depends on the size of the population.
Remember:
population size sample size Standard deviation of the sample mean
INFINITE POPULATION (
Then the standard deviation of the population mean (
where
FINITE POPULATION AND
Then we need to apply the correction factor
FINITE POPULATION AND
Then we need to apply the correction factor
-
- There are 3 but teacher often only uses 2
- The standard deviation of the sample mean is smaller than the standard deviation of the corresponding population distribution:
- The standard deviation of the sampling distribution of
decreases as the sample size increases
Note:
Form of the sample distribution of sample mean
The [[#Sample distribution]] of the sample mean follows different [[Random variables]] distributions depending on the [[#Population distribution]].
Population follows Normal distribution.
Then the sampling distribution of the sample mean is also normally distributed for any sample size.
Population is not normally distributed AND sample size is large (
Then the sampling distribution of the sample mean is also approximately normally distributed, irrespective of the skewed, we need a sample size
Inference of population proportion
Sample distribution of sample proportion
The [[#Sample distribution]] of the sample proportion
In order to define it, we need to know:
- Expected value of
- Standard Deviation of
- The form of the sampling distribution of
Expected value of sample proportion
The expected value of the sampling distribution of
Standard deviation of sample proportion
The [[Standard Deviation]] of the [[#Sample]] proportion depends on the size of the population.
Remember:
population size sample size Standard deviation of the sample proportion. Usually unavailable, then we use
INFINITE POPULATION (
Then the standard deviation of the population proportion (
- [?] Why do we have both
and ? Aren't we looking for anyway?
FINITE POPULATION AND
Then the standard deviation of the population proportion (
- The standard deviation of the sample mean is smaller than the standard deviation of the corresponding population distribution:
- The standard deviation of the sampling distribution of
decreases as the sample size increases
-
- It's just an approximation teacher uses. The mathematically correct form is the one I gave.
Form of the sample distribution of sample mean
The [[#Sample distribution]] of the sample proportion follows a [[Normal distribution]] whenever the sample size
#Sample size is large enough when both of the following conditions are met:
❗❗❗❗❗❗❗❗❗❗❗❗
❗❗❗ COMPLETARE ❗❗❗
❗❗❗❗❗❗❗❗❗❗❗❗ from slide 114 to the end
