Nonlinear follow-the-leader models of traffic flow
Nonlinear follow-the-leader models of traffic flow
Follow the leader theory of traffic
Single-lane dense traffic with no passing.
each driver reacts in some specific fashion to a stimulus from the car ahed of and/or behind them.
The theory applies mainly to dense traffic.
Basic idea:
- response is taken as the acceleration of the vehicle as the driver has direct control over this parameter.
- The stimulus is a function fo the position of cars and their time derivatives (speed)
It has been established that there is correlation between driver response and relative speed of their car and the one ahead. The stimulus is than taken as the relative speed.
Equations
position of the car reaction time sensitivity
Possible sensitivity functions:
where:
(the spacing) are constants
General equation:
This can lead to some specific forms for the sensitivity:
For the validity of each model, we have to look at 2 things:
- Stability - Only for the linear form (otherwise, too difficult)
- Same bounds are applied for the non linear cases
- This is possible as long the nonlinear system only has small perturbations (?piccole oscillazioni?)
- Same bounds are applied for the non linear cases
- Steady-state flow characteristics
Steady flow characteristics
For steady-state flow characteristics is possible to obtain a fairly complete description corresponding to any sensitivity given by an equation such as the one used in the following:
- [?] Pag. 547/548. Why does integrating the equation yields the steady-state flow equation?
Experimental and observational data
2 types of data:
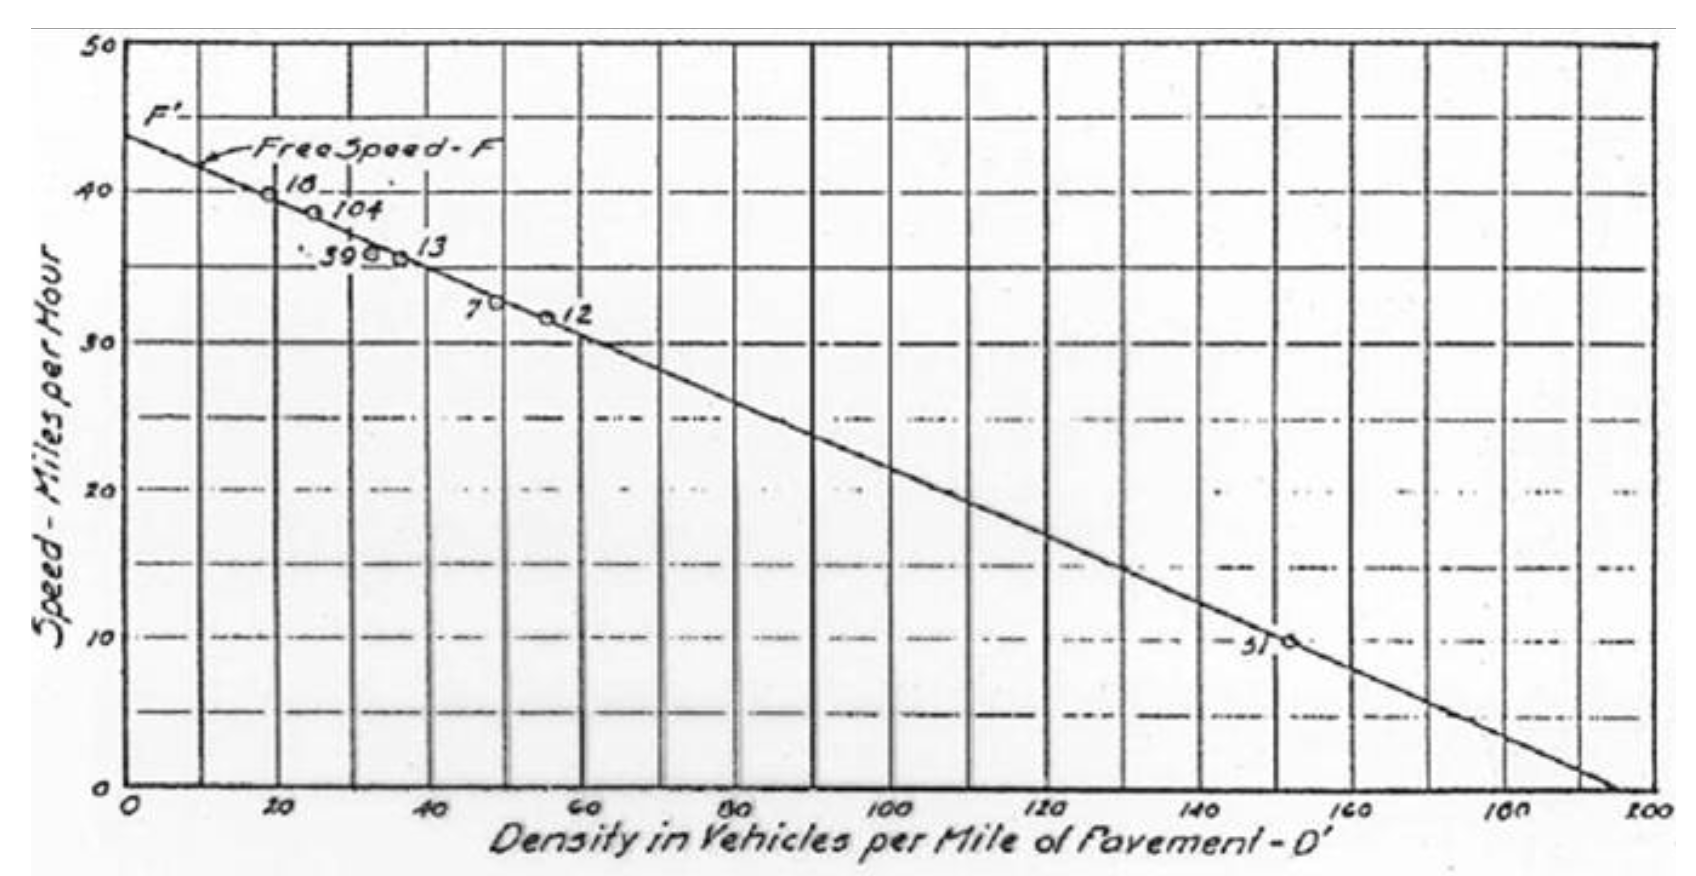
- Phenomenological flow & Density measurements
- Tunnels of New York City area by the Port of New York Authority
- No passing allowed
- Fairly congested for long periods every day
- Tunnels of New York City area by the Port of New York Authority
- Records of follow-the-leader experiments
- General Motors Technical Center test track
- Used to obtain stimulus-response laws with constant sensitivity
- More tests in General Motors Technical Center test track
- Tunnels of New York
- To compare macroscopic phenomenological measurements with microscopic results of follow-the-leader theory
- General Motors Technical Center test track
Phenomenological flow & Density measurements
- Tunnels of New York City area by the Port of New York Authority
- No passing allowed
- Fairly congested for long periods every day
Records of follow-the-leader experiments
- General Motors Technical Center test track
- Used to obtain stimulus-response laws with constant sensitivity
- More tests in General Motors Technical Center test track
- Tunnels of New York
- To compare macroscopic phenomenological measurements with microscopic results of follow-the-leader theory
The data was used in 2 ways:
- Phenomenological study of the time averages of space and speed
- Timewise correlation study of the response of the following car with various functionals assumed for the product of stimulus times sensitivity
Experiment conducted with 2 cars.
Assumptions:
- Headway and speed of the 2 cars are the same of the time and space averages of the whole stream of traffic
First equation (11)
Linear correlation between
Also, they calculated the standard deviation for the coefficient
Difficulties:
- Limited number of runs
. Only 18 - Drivers do not necessarily have the same coefficients
and
The objective was not to find non-integer values of
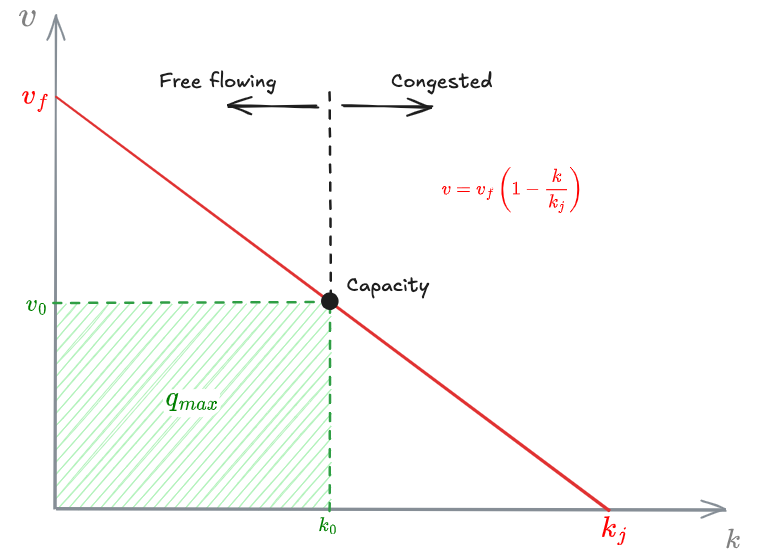
03 - Fundamentals of traffic flow modeling - OMT#Edie k-v model
Follow the leader experiments
Used data of 18 experiments in the Lincoln Tunnel of New York.
2 approaches:
- Phenomenological aspects
- Timewise correlation study


