04 - Statistical modeling through regression - DATS
04 - Statistical modeling through regression - DATS
References:
- Fox, J, Applied Regression Analysis and Generalized Linear Models, Sage Publications
These notes are not intended for a deep understanding of the topic. They are just a guide to try and survive the 📊 DATS exam.
They contain no rigor and may contain mistakes.
The goal is to model a target (or response) variable,
is the vector of coefficients. is a matrix where each column is an exploratory variable. The first column is just 1s.
only describes the systemic component.
The vectorhas the same length as the target variable.
Part of the variability of the response is not describied in
where
To summarise:
Model in R
If all exploratory variables are numeric, the process is quite simple. The rules described above all stand.
In R-studio we proceed as follows:
- Y: target variable
- X1, X2, ..., Xp: All the exploratory variables (There are a number p of them)
m1 <- lm(Y ~ X2 + X3 + ... + Xp)
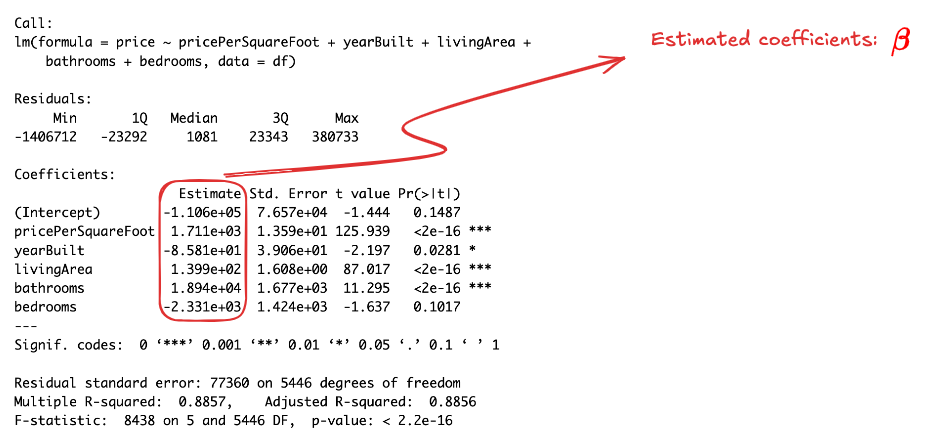
summary(m1)
Then we do a summary of the model

FISHER-ANOVA:
We can try making a new model with less variables.
Let
We can use the FISHER test to verify if the 2 models are equivalent. If they are, it's better to use the smaller one.
Fisher test: H0 = Models m and M are equivalent
Accept H0 Reject H0 --> Need to use big model M
In R studio this test is done using the function anova(m1,m2)
anova(m1, m2)
Read p-value of the test.
If using glm(), then use the Wald test
Unusual and influential data
Regression outlier: observation with unusual value of the outcome variable Y, conditioned by the value of the explanatory variable X.
LEVERAGE
- An observation with high leverage has an unusual X value and has leverage on the regression line.
- Leverage is higher for an observation further away from the mean of X
- If the value has high leverage but still fall onto the regression line, this is not a problem as it does not influence the regressio coefficients
INFLUENTIAL OBSERVATIONS:
- If an observation has high leverage and also falls far from the regression line, then is considered influential.
- It has unsual X value and Y value
influencePlot() can give what are the most influential observations:
influencePlot(m1, pch=19, id = list(method="noteworthy", n=3))
OUTPUT:
